


Greetings, my wonderful friends in the world of personalized video! Welcome to the first-ever edition of Uni’s Corner; I’m your horned host, Uni The Unicorn!
I know many of you may be thinking, “But, Uni… aren’t unicorns mythological?”
Neigh, I say! I am very much real and have been diligently working in the Development Department at ThankView University for the past few thousand years.
You see, after the great Unicorn-Centaur War, waged largely over the divisive topic of how to properly engage with constituents.
Editor’s Note: the centaurs strongly believed in only one, generic direct mail piece per year, while we unicorns strived for a more personalized, thoughtful connection.
The unicorns dedicated the rest of their existence to creating a world where audiences could be cultivated, stewarded, and thoroughly engaged through the use of personalized video. This is why you’ve never seen a unicorn in real life; we’re too busy trying to get in touch with our donors.
Enough history, we’ll have more time to review that, today I’m here today to talk with you about something that holds a very special place in my heart — right next to magic and glitter — and that is cold, hard data.
Data has become such a coveted, valuable asset that some even consider it to be worth more than gold. And what better way to view all this highly sought after data than through ThankView’s Metrics page!
Easily accessed by clicking the “Metrics” button in the top right corner of your ThankView homepage, ThankView’s Metrics page offers you invaluable information on your audience’s engagement.
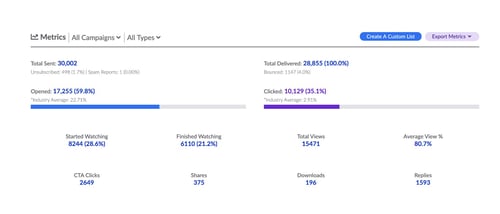
View the data in a fully encapsulating dashboard, allowing you to see all your campaigns at once, and providing an aggregate total for everything from “Sent” and “Delivered,” to “Opened” and “Viewed,” and everything in between! (Who’s got four hooves and a fantastic open rate? This unicorn, right here!)
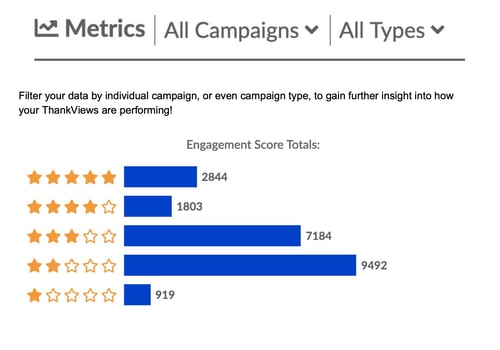
Filter your data by individual campaign or campaign type to gain further insight into how your ThankViews are performing.
Utilize ThankView’s “Engagement Score” to discover your most valuable audience members. The score is calculated by each and every action a recipient can take — from opening their email, to how many times they watch, if they shared your video — and so on!
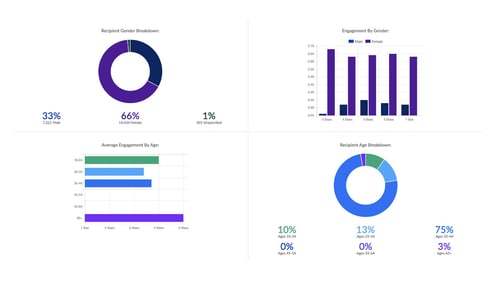
Break your audience down based on location, gender, device, and even age! (Fun fact: I am the oldest recipient of a ThankView, at 4,719 years old!)
Lastly, export both your recipient and your campaign metrics to have them delivered directly to your email in .csv format! You can import this information back into your respective CRM or database to ensure all of your outreach, as well as your constituents’ engagements, are properly tracked!
ThankView’s advanced metrics allow for you to get the best sense of not only who is engaging with your outreach and where they’re doing so, but also how they’re engaging and how many times!
If you ask me, it’s nothing short of magic. And I should know. I’m a unicorn.
Until next time,
Uni the Unicorn

Uni’s voice is created by the incredible Terry Mooney. For more answers on how ThankView metrics can help your organization or details of Uni’s sordid past, click here to schedule a demo with him.